| Home |
| Curves Readme |
| Curves Tutorial |
| History |
| Downloads |
| Plans |
| Links |
| Contact |
| Donate |
Gradation Curves Tutorial
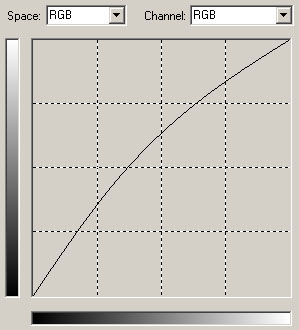
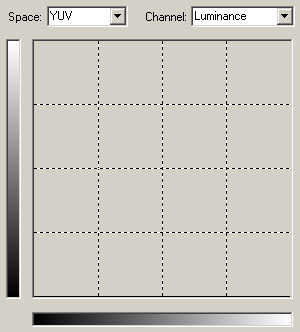
The filter configuration window:
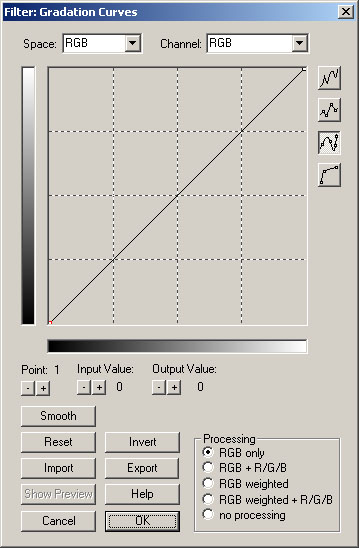 The x-axis represents the input values, the y-axis the output values. With the initial 45° line the input values will be the same as the output values and no processing will be done.
In each color space different channels can be manipulated. The RGB space has one special curve that the other color spaces do not have: a combined RGB curve that manipulates all the three channels (R/G/B) at once.
Many of the shown effects can be combined and different manipulations can be made with one instance of the filter only.
All the examples have got a mouseover effect. With java script enabled, by moving over the image the original unprocessed image will appear.
Each example curve can be downloaded and imported into the filter.
Index:
Basic manipulations using the RGB curve
Advanced manipulations using the RGB curve
Basic manipulations using the R/G/B curves
Advanced manipulations using the YUV / HSV curve
Other tutorials can be found under Links
Basic manipulations using the RGB curve:
Brightness:

Download: brightness-.amp
If the curve is moved down vertically the brightness decreases:

The contrary is possible as well:

Download: brightness+.amp
If the curve is moved up vertically the brightness increases:

Contrast:

Download: contrast-.amp
If the inclination of the curve is decreased the contrast decreases:
The contrary is possible as well:
Download: contrast+.amp
If the inclination of the curve is increased the contrast increases:
Gamma:

Download: gamma-.amp
If the curve is bent down the gamma value decreases:
The contrary is possible as well:
Download: gamma+.amp
If the curve is bent up the gamma value increases:
Coring:

Download: coring.amp
If the curve is set to zero for a certain range all of these input values will be set to zero:
Advanced manipulations using the RGB curve:
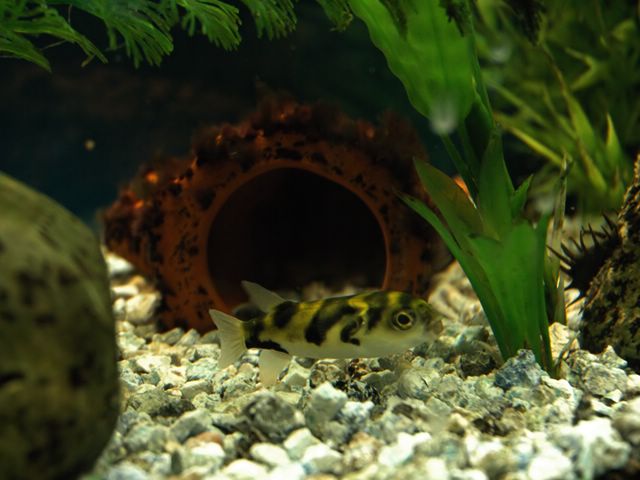
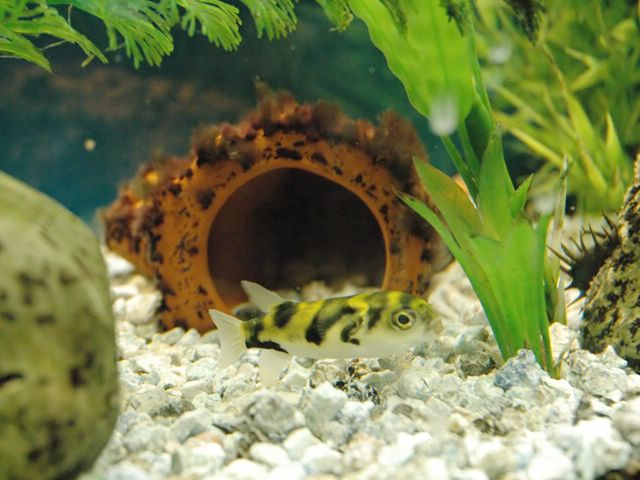
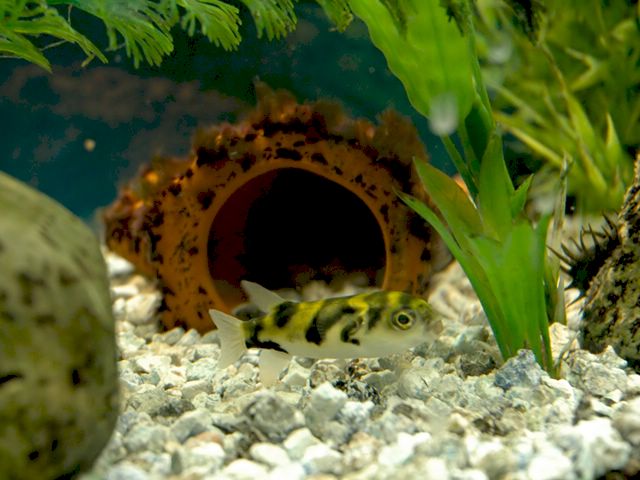
Advanced correction:

Download: correction.amp
The curve brightens up dark areas while darkens bright areas.
Before the feathers of the bird where indistinguishable black after the application of the curve they are better defined:

Color reduction:
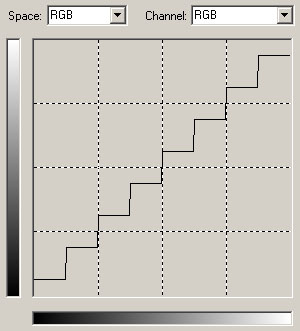
Download: colorreduction.amp
If the curve has got steps the amount of colors will be reduced. Larger steps will result in less colors:

Funky Colors:
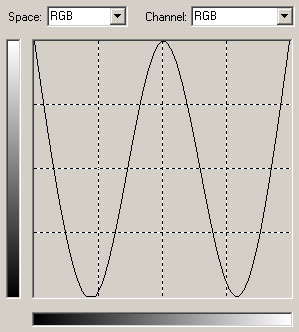
Download: funky.amp
A curve like this can give funky results:

Basic manipulations using the individual R/G/B curves:
Increasing the amount of red:

Download: red+.amp
To activate the individual manipulations of the R/G/B curves "RGB + R/G/B" must be selected under Processing.
This curve increases the red value of each pixel by a value of 10.
Starting with red input values above 245 the curve reaches the ceiling because higher red-values than 255 are not possible:
Reducing the amount of blue:
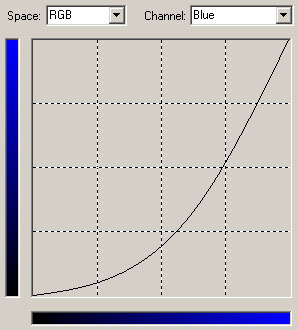
Download: lessblue.amp
This curve decreases the amount of blue considerably in a non linear way.
While for input values near to zero and near to 255 the blue value is reduced only a little bit, for values around 128 it is changed much:
Advanced manipulations using the YUV color space:
Black and white video:

Download: blackandwhite.amp
First set the ChromaB and ChromaR curves to a straight line with the value of 128. The result of this is a grayscale video.
Then set the Luminance curve to have two values only. Then the video will be black and white only:

Depending on the position the curve jumps from 0 to 255 the result will be different. The HSV or Lab space could be used as well to achieve this effect.
Demonstration - zero Luminance:
Download: noluma.amp
If the Luminance channel is set to zero only the chroma channels will be visible. If your source is video and not from professional equipment you will probably notice the reduced resolution of the chroma channels:
Since the source of this sample was a digital photo, the chroma channels have the full resolution (4:4:4).
Note that if only a manipulation of the Luma channel is needed in YUV space, this can also be achieved by selecting the "RGB weighted" processing mode in the RGB space.
The weighted mode calculates the grey (luma) value of each pixel and then applies the output value to the RGB value of the pixel.
This will be a little bit faster than using the YUV space, because no full conversion to YUV and back has to be done.
Advanced manipulations using the HSV color space:
Heri's toonize-inks:

Download: heri_toonize-inks.amp
Download: heri_toonize-inks_smartcurve.amp import by selecting Smartcurve HSV
Changing the Value curve in this way while leaving the Hue and Saturation curve unchanged will result in a cartoon like effect:

Read more here: Heri's tutorial (Unofficial VirtualDub Support Forums)
Advanced manipulations using the Lab color space:
General information about the color difference channels (a/b) and the Lab space:
 The a (red-green) and b (yellow-blue) curves are two special curves (just like cb and cr in YUV) that can be used to manipulate two colors at once. In the lower left part of the curves (green & blue) lowering values will increase the amount of green and blue whereas in the upper right part lowering the values would decrease the amount of red and green.
But unlike the individual R/G/B curves of the RGB space where a general increase of green would affect all pixels, in a/b an increase of green affects the pixels that contain green with "dominant" values. To understand what is meant the best is to play with some color sample images.
An a channel curve that lies straight on the center axis would result in removing all the color of that channel. As I normalized the a/b channels (just like cb and cr) to have values from 0 to 255 the center axis lies for the a channel on a value of 119 and for the b channel on a value of 136.
Why not 128 for the center axis like for cb and cr in YUV? I did choose different values for a and b because this way I minimize errors. The L channel is normalized from 0 to 255. In other application common values for L are 0 to 100 and for a/b -128 to 128.
For example the set of L:88 a:-90 b:81 (in not normalized values) would result in R:-56 G:257 B:24 and this is a color that is not displayable in RGB. I simply calculated the lowest and highest possible value for the a channel converting RGB to Lab and normalized this from 0 to 255. The resulting center axis lies on 116 for the a channels as a result of this. This way no color depth resolution is lost unnecessarily for colors that are not displayable in RGB.
General Information about the Lab color space: Lab color space - Wikipedia
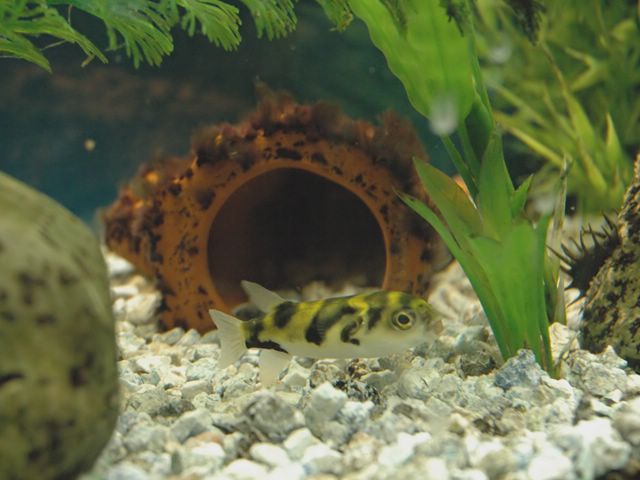
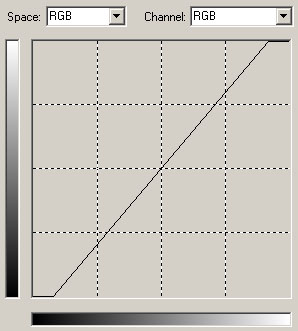
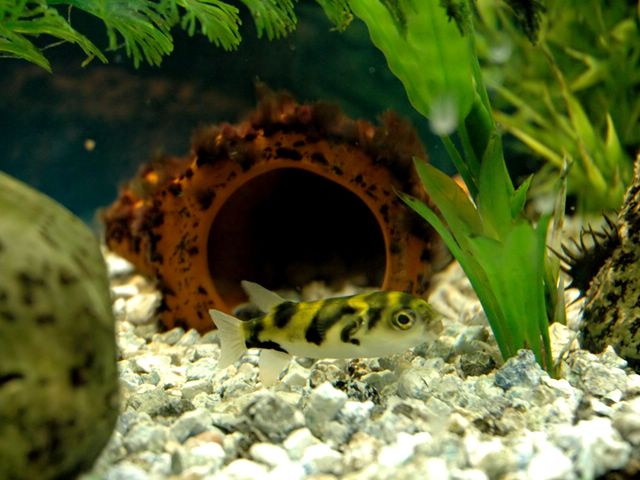
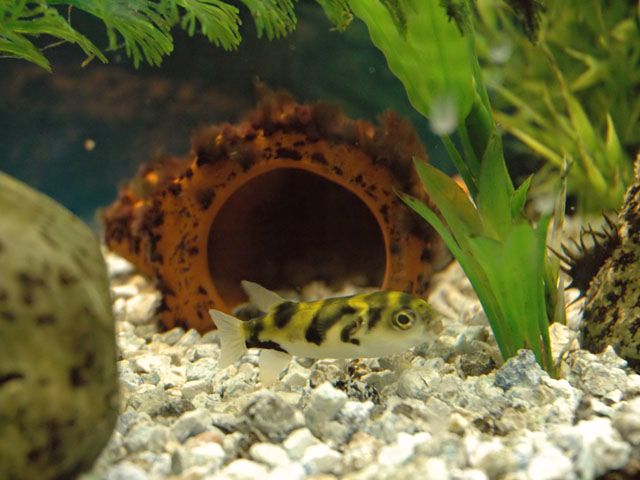
Advanced color correction:

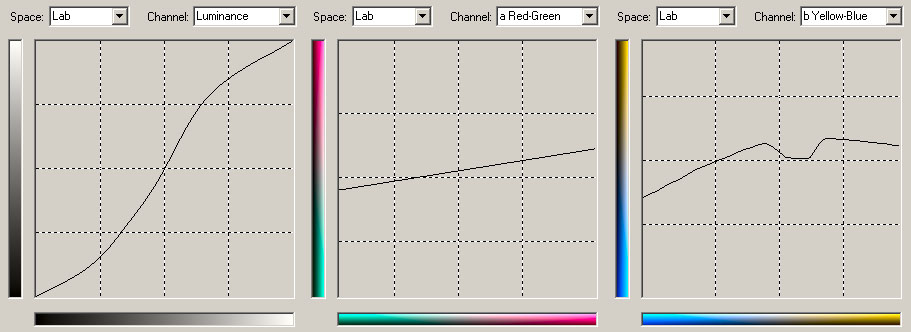
Download: labcolorcorrection.amp
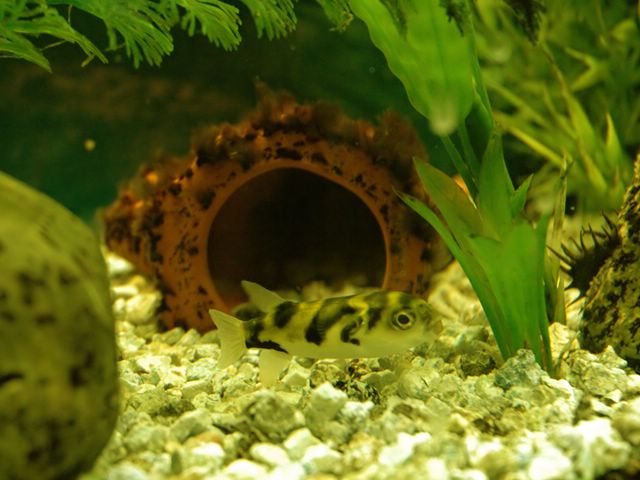
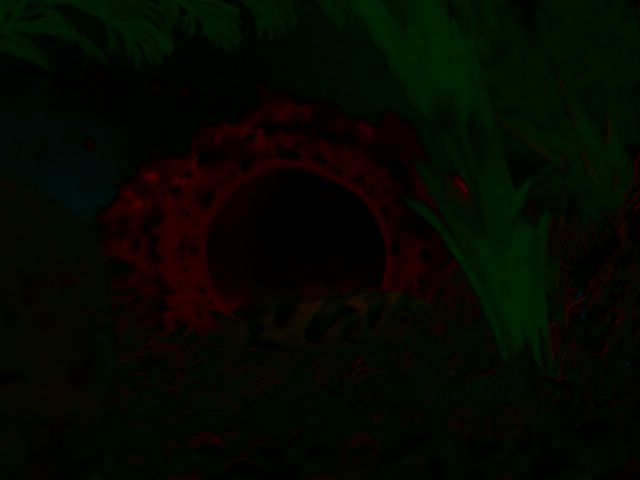
The source is a photo taken with a digital camera in an oceanarium with suboptimal light conditions. The above curves will apply a nice correction:

The Lab color space was designed to approximate human vision. So although the YUV space uses a similar logic with a luma channel and two color difference channels manipulating the Cr and Cb channels will give different results compared to a and b. In my personal experience the a/b channels are much more suited to manipulate/correct colors than Cr/Cb of the YUV space. After experimenting with the Lab space some time now I do generally like it a lot for different kinds of manipulations, corrections and enhancements.
Sepia "300like" color look:
Download: 300like.amp
The colors are reduced and there is a shift to red and yellow:

| Copyright © 2003-2008, Alexander Nagiller, All Rights Reserved. |
|